
By Lucy Parkinson, Senior Research Manager, LSN

LSN will be heading to Houston in June for our next RESI event, so we decided to take a closer look at a sample of life science companies based in seven Southwest states—the types of innovation taking place in these companies and the number of products emerging from the biotech pipelines.
We looked at companies based in Arizona, Colorado, Nevada, New Mexico, Oklahoma, Texas, and Utah. The sample was drawn from the LSN Company Platform, which partners with bioclusters around the world to gather information on early-stage life science companies.
Our sample consists of biotech companies with assets that are at least in the preclinical stage and not beyond Phase III, and medtech companies with products currently in development; neither life science service providers nor biotech companies at the discovery or lead-optimization stages were included. While most of these companies were located in Texas, the sample included companies from every one of the seven aforementioned states.
The collective pipeline of the biotech companies consists of 323 products, and we were able to track 301 by key indication area. (See Figure 1.) Cancer is by far the most common, accounting for more than one-third of the assets. Other leading areas of innovation include infectious diseases and neurology.
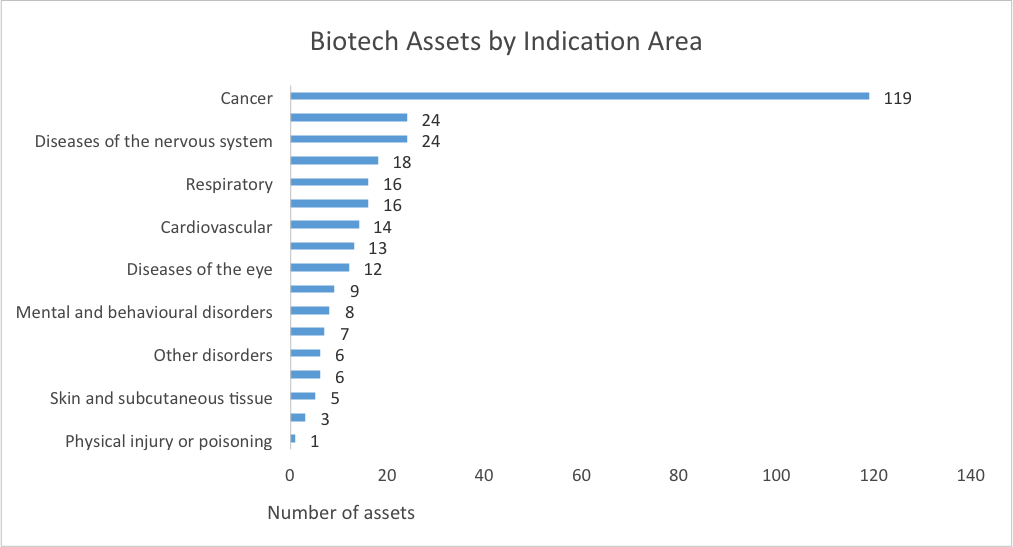
Figure 1 | Source: LSN Company Platform, Data as of February 25, 2015
The medtech companies have 59 products that span a wide variety of fields. (See Figure 2.)
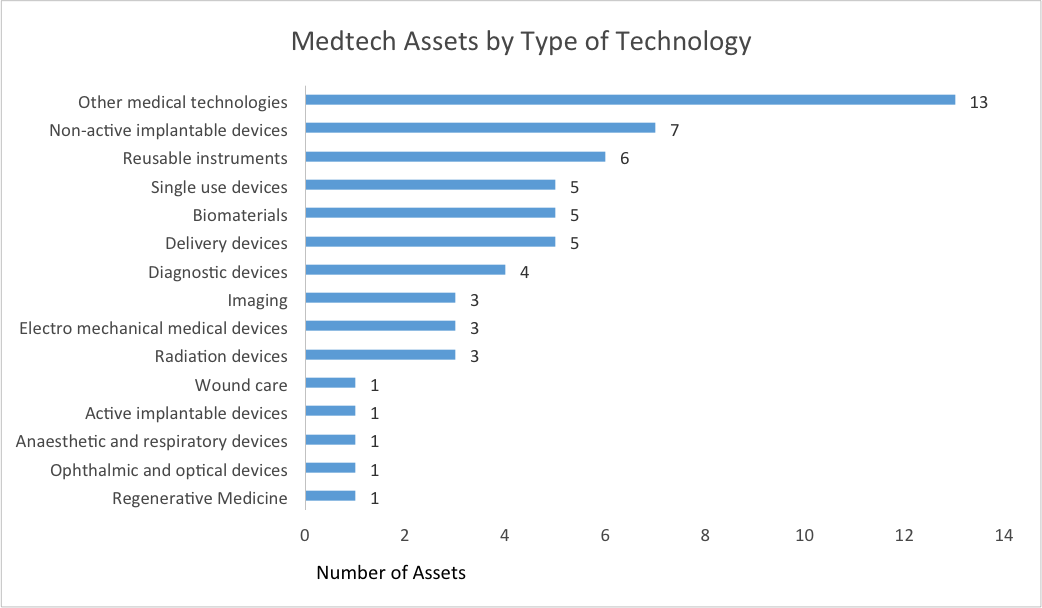
Figure 2 | Source: LSN Company Platform, Data as of February 25, 2015
The LSN Company Platform also tracks the progress of the biotech products through the pipeline. (See Figure 3.)
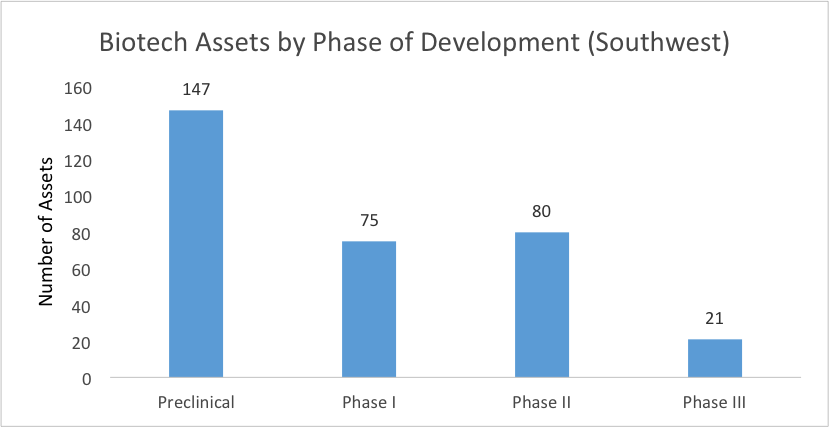
Figure 3 | Source: LSN Company Platform, Data as of February 25, 2015
As one would expect, the number of assets falls sharply following the preclinical stage, as both companies and their investors look for “go/no-go” signs in their animal data; a second steep drop happens following Phase II efficacy studies. What’s unusual about life science innovation in these states is the steepness of that second drop, as we can see by comparing these results to an analysis of companies across the U.S. (See Figure 4.)
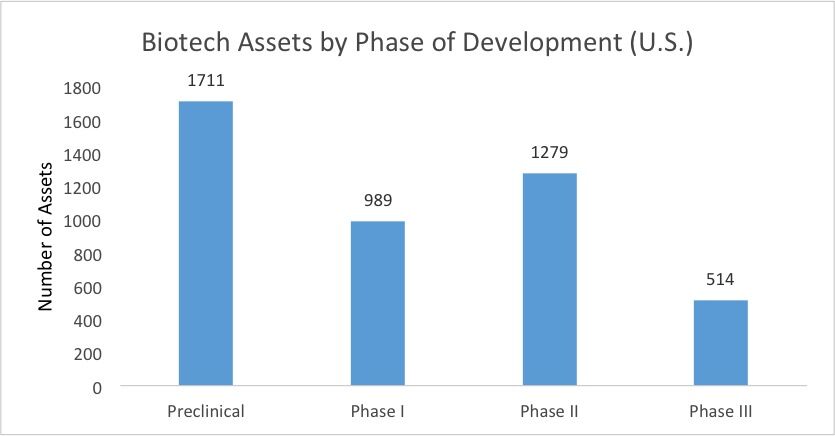
Figure 4 | Source: LSN Company Platform, Data as of February 25, 2015
The skew toward early stage assets is greater in these seven states than it is for the nation. There are 7 preclinical assets for every 1 asset that reaches Phase III, whereas for the U.S. as a whole, there are 3.3 preclinical assets for every 1 asset that reaches Phase III. The skew could be because strong companies leave for the East Coast or the West Coast or are acquired by entities based in other regions before the lead asset reaches Phase III. It could also be due to a more restricted funding environment, which may make companies more likely to close their doors after mixed results in Phase II.
In addition to biotech and medtech companies, these states are also home to a number of early stage life science investors who are open to investing in precommercial life science products. (See Figure 5.)
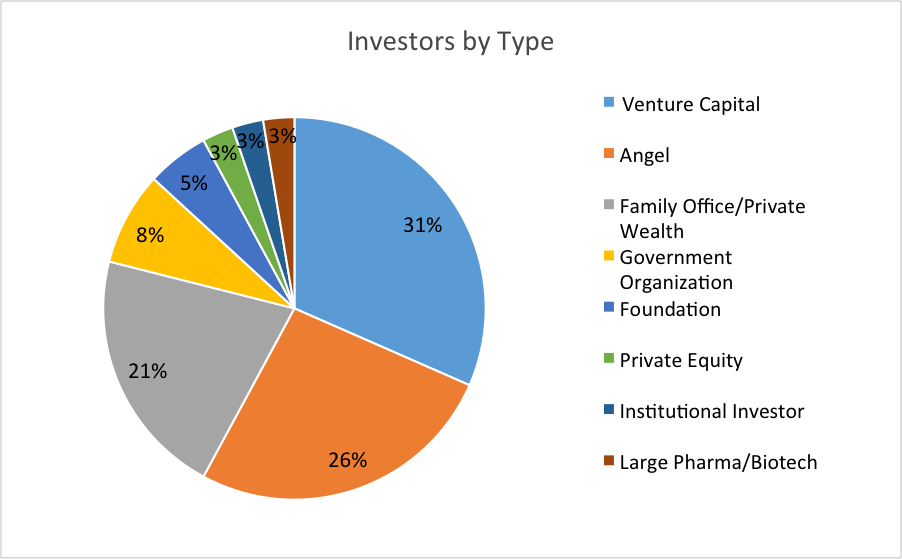
Figure 5 | Source: LSN Investor Platform, Data as of February 25, 2015
While examining investor exposure in these states, we found that a substantial number of investors are interested in opportunities not only in their own backyard but also globally. A core pillar of the RESI conference is providing entrepreneurs with a broad audience of investors—local, regional, national, and international—and we look forward to providing an opportunity for this audience to meet with life science entrepreneurs in these states and beyond.


Leave a comment