By Michael Quigley, Director of Research, LSN
It is no secret that 2015 has been a highly active year for deal-making in the life science space. However, what is often overlooked is exactly where in the space those deals are taking place. Life Science Nation’s financing rounds database contains detailed information on over 250 of these rounds that have taken place since January 1 of 2015. We track this data from a variety of sources however as many companies and investors chose not to disclose this information this should be viewed as a sample of the entire data set of financings. With this article will highlight what our data tells us about the rounds that have taken place thus far in 2015 for therapeutics companies around the globe.
The first cut worth examining is the types of technologies that received funding.
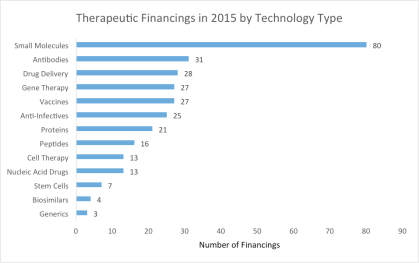
As this chart represents the funding of all stages of development, it should again come as no surprise that small molecules are the most popular technology type receiving funding. Things get more interesting when we take a deeper look here at the types of technologies in the preclinical and Phase I of development that received funding.
While small molecules are still receiving the highest number of individual financings, in the early stage (preclinical and Phase I) they are ahead by a significantly smaller margin. Also, at this early stage we see gene therapy taking the number two spot, receiving 33% more financial rounds than antibodies. These companies include those working toward single gene mutation orphan diseases whose expedited regulatory approval process attracts investors, as well as those utilizing recent advancements in gene therapy to develop novel treatments for various cancers, diseases of the eye, and HIV/AIDS.
Another interesting perspective on the financing rounds data comes from looking the indication areas that received investments. (As many companies target multiple indications, a significant number of the rounds that are tracked count toward more than one indication.)
This chart should come as no surprise to anyone who has been in the industry for the past few years. Oncology is the clear leader, securing the largest number of individual financing rounds, followed by diseases of the nervous system fueled by a number of investments in Alzheimer’s disease, Parkinson’s, and ALS. Endocrine, nutritional, and metabolic diseases take the third spot, driven by a high level of investor interest in the expedited regulatory pathways for the numerous orphan indications that fall into this category, paired with the massive and growing market opportunity represented by diabetes.
A third angle that provides interesting insight into therapeutic financing rounds for 2015 is looking at the phase of development of the lead asset for companies that have received financing.
At first glance this seems like a great sign for preclinical stage companies, which thus far in 2015 have been able to secure the second highest number of financings. Now while this is definitely an indicator of investor interest in the early stages of product development, a few things must be considered to understand fully the current competitive landscape. First, there are significantly more companies competing for those preclinical financing rounds than those looking for financing for Phase II assets. In our company platform, we have identified north of 650 companies with a lead asset in Phase II and nearly twice that number with lead assets in the preclinical stage. It should be noted that preclinical companies are often low profile entities and are difficult to track, so these figures do not reflect 100% of companies developing a preclinical lead asset. The key takeaway here is that investors are indeed making allocations to preclinical stage companies and at a significant pace; however, the competition for those dollars remains high.
2015 has been a banner year for therapeutics investment so far, and we are excited to see what the rest of the year will bring. Based on the conversations we’ve had with over 800 investors in the space, we see no signs of a slowdown in deals getting made. If you are out there fundraising, competition is tough without question, but money is moving and it is largely a matter of finding the right investors at the right time.


Leave a comment